
One of your queries in Power Query Editor seems to be taking a lot longer to refresh than you expect. You need to understand what Power Query is doing at authoring and at refresh time.
How would you go about this?
The latest changes and updates from the administration for this exam.
Latest Update: Jun 15 2026
All questions are working fine.
One of your queries in Power Query Editor seems to be taking a lot longer to refresh than you expect. You need to understand what Power Query is doing at authoring and at refresh time.
How would you go about this?
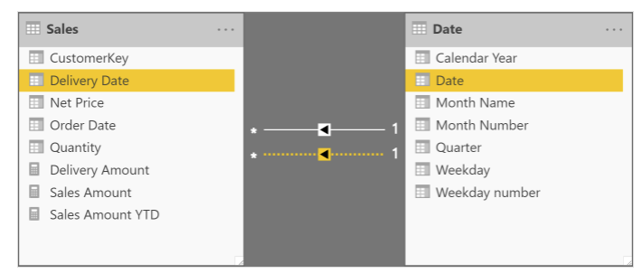
You are designing a data model and have a Date table and a Sales table as per the below exhibit. You create an active relationship between Date[Date] and Sales[Delivery Date]. You also create an inactive relationship between Date[Date] and Sales[Order Date].
How would you create a measure with the inactive Order Date by filling in the correct DAX function in [VALUE]?
CALCULATE (
[Sales Amount],
[VALUE] ( Sales[Delivery Date], 'Date'[Date] )
)
Your client wants to only show the five US states with the most orders in the past year. Which of the following methods will best visualize the necessary data?
True or False: A Power BI Data model can contain only import tables or Direct Query tables; it is not possible to have both in the same data model.
You work for a bank and have a large dataset for credit card transactions for a city. The data is in a Microsoft SQL Server database and has over 15 million rows. Before you use the dataset, you want to import a sample of the credit card data.
How could you achieve this goal?
Imagine you have a datetime data column with various datetime values. Converting the column to a date datatype will have which effect on cardinality?
Suppose you have a data model that contains two tables: Sales_Fact and Calendar_Lookup. You want to connect the Order Date and Transaction Date fields in Sales_Fact table to a single date field in a Calendar_Lookup table. What type of relationship(s) will be used?
Reference lines and forecasting can be applied in the which pane?
You can interact with T and Python visuals by hovering over them and clicking on them to cross-filter other visualizations on the page.
A client would like a clear view of the sales performance on weekdays and weekends. Which of the following functionality will help you easily provide the answer?