Performance overhead of the Query Store
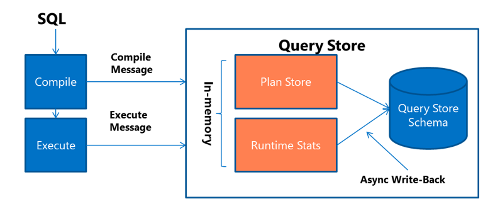
Collecting data in any system has an execution cost of CPU cycles, memory, and disk utilization that is known as observer overhead. The Query Store is designed to minimize the impact of its data collection. Data for the Query Store is written to memory for each new query, and each execution of an existing query. If this information was written to disk for each execution, the performance overhead would be significant, so SQL Server uses a setting called DATA_FLUSH_INTERVAL_SECONDS to control the frequency of flushing the Query Store data to disk. By default, the data is flushed every 15 minutes, but this value is a user configurable setting per database. This process of collecting the query and runtime information and writing it to disk is shown in the image below:
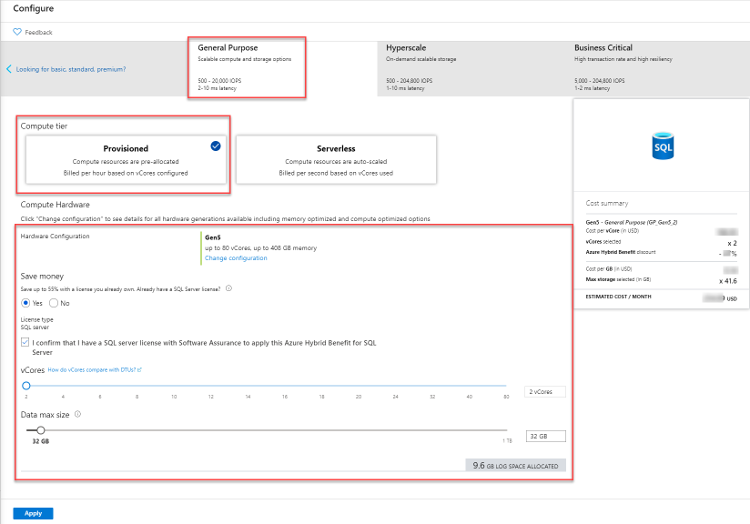
The other important setting to note in the Query Store options is Max Size (MB), which sets the amount of storage for the data collected. The default value is 100 MB and is commonly increased to around 1-2 GB depending on the volume of queries executed against a database. Some workloads that have a high number of unique ad-hoc queries, which is characteristic of applications written in Entity Framework, may see high data volume. If the size of the data stored on disk exceeds the Max Size (MB) the Query Store will go into read-only mode until more space is added, or cleanup happens. The default value for time-based cleanup is 30 days, but the size-based cleanup mode option will remove older queries as the Query Store approaches its max size. You will want to strike a balance between the amount of data you keep and the amount of space being consumed on disk.
The other setting you should note is Query_Capture_Mode which defaults to Auto. This value means queries with insignificant compilation time and duration are ignored, along with infrequent queries. This default was changed in SQL Server 2019, and in Azure SQL. The older default was All, which captures all queries executed. There are also options of none (collect no queries) and Custom, which was also introduced in SQL Server 2019, which allows you to use metrics such as execution count, compile CPU time, and execution time to limit which queries are captured. This setting is useful for a database where most of the queries are unique, as these unique queries can cause the Query Store to grow rapidly in size.
Plan forcing in the Query Store
Another benefit of the Query Store is the ability to force a given execution plan for a query. Plan forcing in the Query Store also drives the automatic tuning feature that was introduced in SQL Server 2017, which uses the last known good execution plan for a given query after a performance regression occurs. Since the query can store multiple execution plans for a given query, you can have the database engine force a known good plan for a given query. Plan forcing should be used for queries that have suddenly changed execution plans and have experienced significant regression in execution time. Plan forcing offers a quick mitigation for a performance problem, but you should always investigate what caused the performance regression and look to resolve the cause of the execution plan variability. Those fixes could be adding an index or looking to rewrite part of a query.
https://docs.microsoft.com/en-us/azure/mysql/concepts-query-store